
Effective video ad testing on a small budget hinges on a modular creative system, not a larger testing budget.
- Focus on conversion signals (CPA, ROAS) over vanity metrics like CTR.
- Build a library of reusable video « Lego blocks » (hooks, bodies, CTAs) to maximize creative velocity.
- Proactively monitor for performance decay to know when to kill winning ads before they burn out.
Recommendation: Shift from one-off tests to an always-on creative iteration process that generates insights with every dollar spent.
For a digital marketer with a limited budget, the « test everything » mantra feels less like a strategy and more like a fast way to burn cash. You know you need to A/B test your video creatives on Facebook, but every failed test eats into a budget that has no room for error. The conventional wisdom to « test one variable at a time » or « let it run for 72 hours » is sound, but it doesn’t solve the core problem: how do you generate meaningful insights and find a winning ad without an enterprise-level spend?
The answer isn’t a bigger budget for testing. It’s a more intelligent system for creating. The most common mistake is treating A/B testing as a simple competition between two finished videos. This approach is slow, expensive, and yields minimal learnings. What if the real key wasn’t the test itself, but the creative development process that precedes it? If you could build your video assets in a way that makes testing faster, cheaper, and exponentially more insightful, the budget constraint would become almost irrelevant.
This guide provides a data-driven system for exactly that. We’ll move beyond the basics of setting up a split test and focus on building a modular creative engine. You will learn to prioritize the right metrics, assemble video variations with high creative velocity, understand the nuances of different creative styles, and manage the entire lifecycle of your ads from launch to burnout. This is how you turn testing from a cost center into a data-generation machine that consistently lowers your CPA.
This article provides a complete system for efficient video creative testing. Here is the structure we will follow to build your data-driven testing engine.
Summary: A/B Testing Facebook Video Ads on a Small Budget: A System for Finding Winners Faster
- Why Click-Through Rate Means Nothing If They Don’t Convert?
- How to Shoot Video « Lego Blocks » for Endless Remixing?
- User Generated Content or High-Gloss Ad: Which Lowers CPA?
- The Frequency Mistake That Makes Your Audience Hate Your Brand
- When to Kill a Winning Ad Before It Burns Out?
- Why Starting with the Problem Stops the Scroll Faster Than a Logo?
- Why Do 60% of Viewers Abandon Your Sales Video Before the Call to Action?
- How to Use Gated Video Content to Capture High-Quality B2B Leads?
Why Click-Through Rate Means Nothing If They Don’t Convert?
The first rule of small-budget testing is to obsess over the right signal. A high Click-Through Rate (CTR) feels good—it means your creative is grabbing attention. But attention doesn’t pay the bills; conversions do. In performance marketing, a high CTR paired with a low Conversion Rate (CVR) is a classic symptom of a disconnect between your ad’s promise and your landing page’s delivery. It’s an expensive way to generate unqualified traffic. The data confirms this is a widespread issue, as 80% of industries saw decreased conversion rates despite having stable or even improving CTRs in recent years.
This gap highlights the danger of optimizing for a vanity metric. Your primary goal isn’t clicks; it’s a low Cost Per Acquisition (CPA) or a high Return On Ad Spend (ROAS). To diagnose performance accurately, you must analyze CTR and CVR together. A structured approach allows you to quickly identify the root cause of poor performance and focus your iteration efforts where they will have the most impact. This is the foundation of efficient testing—chasing the right conversion signal from the very beginning.
Use a simple diagnostic framework to guide your next move:
- High CTR + Low CVR: The problem isn’t your ad creative; it’s your post-click experience. Test the alignment between ad copy and landing page headline, the clarity of your offer, and the friction in your checkout or lead form process.
- Low CTR + High CVR: Your offer and landing page are compelling, but your ad isn’t stopping the scroll. This is a clear signal to focus on improving your video’s hook, visual appeal, and core messaging.
- Low CTR + Low CVR: This points to a fundamental mismatch. Before testing creative, you must reassess your audience targeting and your core value proposition.
- High CTR + High CVR: You’ve found a winner. The next step is to scale the budget methodically while closely monitoring frequency to prevent burnout.
By focusing on the relationship between these two metrics, you move from guessing to data-driven diagnosis, ensuring every test provides a clear and actionable insight.
How to Shoot Video « Lego Blocks » for Endless Remixing?
The secret to high testing velocity on a small budget is to stop thinking in terms of « videos » and start thinking in terms of « components. » This is the modular asset library concept, where you create a collection of interchangeable video parts—or « Lego blocks »—that can be quickly remixed into dozens of variations. Instead of shooting two completely different 30-second ads, you shoot multiple, distinct building blocks.
This approach dramatically lowers production costs and increases your capacity for insight generation. Your core components should include:
- Hooks (1-3 seconds): At least 3-5 different opening shots or statements designed to stop the scroll. Test a question, a surprising statistic, a problem statement, or a dynamic visual.
- Body/Value Props (5-10 seconds): Several clips explaining the problem, demonstrating the product, showing social proof (like a testimonial), or highlighting different benefits.
- Calls to Action (CTAs) (1-3 seconds): Different closing statements or end cards. Test a direct command (« Shop Now ») versus a benefit-oriented close (« Start Your Transformation »).
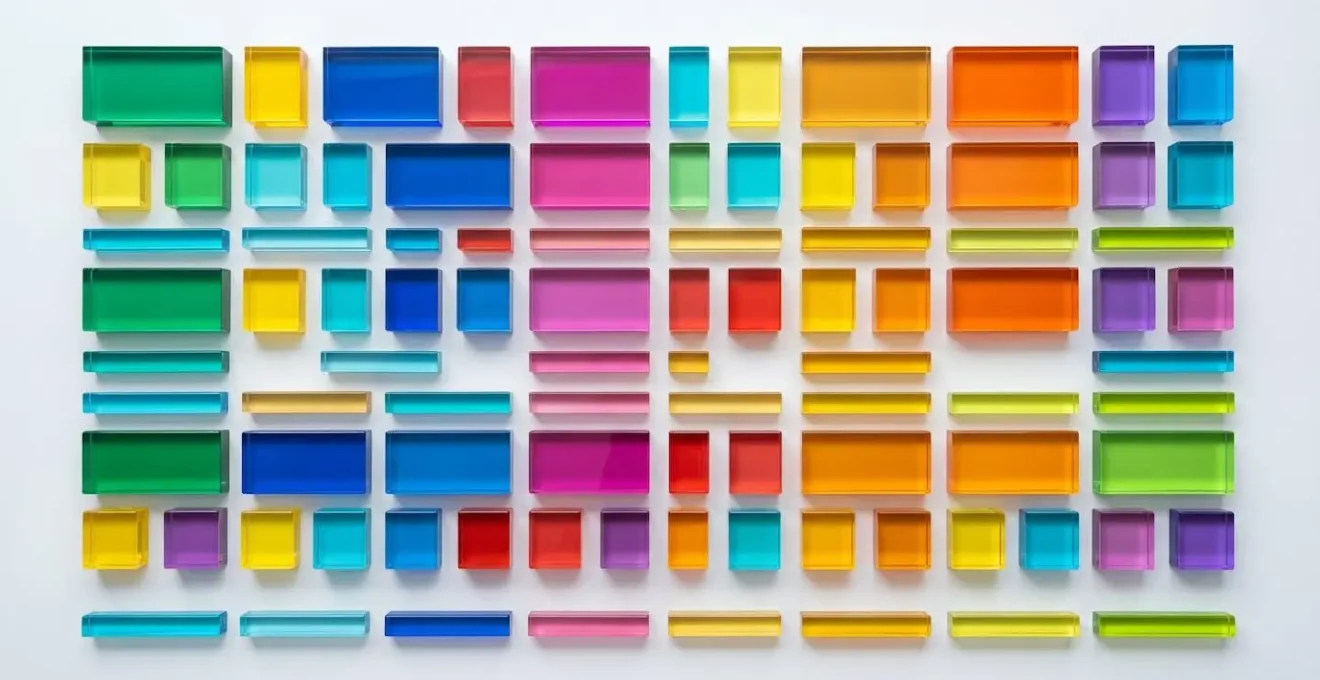
The illustration below visualizes this system. Each colored block represents a reusable asset—a hook, a value prop, a CTA—ready to be combined into a new ad variant. This system turns creative production into a streamlined assembly line.
With this library, you can assemble a new ad in minutes, not days. Testing « Hook A + Body B + CTA C » against « Hook D + Body B + CTA A » becomes simple. This systematic approach was validated in a case study by Meta, where security company HomeSecure tested modular video ads with informative versus competitive messaging variations. By systematically A/B testing these video components, they achieved a 29% lower cost per incremental purchase, proving the power of a modular system.
This strategy transforms your creative process from a series of one-off projects into a continuous engine of iteration and learning, perfect for any budget.
User Generated Content or High-Gloss Ad: Which Lowers CPA?
Once you have a modular system, the next question is what kind of « Lego blocks » to create. The two dominant styles are authentic, lo-fi User-Generated Content (UGC) and polished, high-gloss professional ads. The answer to which performs better is not a simple « one or the other. » The right choice depends entirely on your audience’s temperature—their level of awareness and relationship with your brand. Testing these formats against each other is a critical step in finding what resonates with each segment of your funnel.
The power of testing is undeniable; Meta’s internal research reveals that winning A/B tests drove a 30% lower cost per result on average. A major lever for achieving these wins is matching the creative style to the audience’s mindset. For cold audiences who have never heard of you, authenticity builds trust faster than polish. A UGC-style video feels like a recommendation from a peer, not a sales pitch, which can significantly lower the barrier to entry and boost initial engagement.
Conversely, for hot audiences who already know and trust your brand (e.g., retargeting a cart abandoner), a high-gloss ad can reinforce brand quality and justify a premium price. A UGC ad at this stage could potentially feel « cheap » and devalue the brand. The key is to test these formats strategically across your funnel.
This comparative framework shows how to deploy UGC and professional creative based on audience temperature, as highlighted in a recent analysis of testing strategies.
| Audience Type | UGC Performance | High-Gloss Performance | Recommended Approach |
|---|---|---|---|
| Cold Audiences | Higher trust & CTR | Lower initial engagement | Start with UGC |
| Warm Audiences | Moderate performance | Increasing effectiveness | Mix both formats |
| Hot Audiences | Risk of appearing cheap | Better for scaling | Prioritize professional |
Instead of declaring one format the « winner, » build a library of both UGC and high-gloss « Lego blocks » and deploy them where they will have the most impact, turning your funnel into a finely tuned conversion machine.
The Frequency Mistake That Makes Your Audience Hate Your Brand
Even the most brilliant, high-converting video ad will fail if you show it to the same person twenty times in a week. This is ad fatigue, and it’s the fastest way to kill your campaign’s momentum, spike your CPA, and damage your brand’s reputation. Frequency, the average number of times a user has seen your ad, is a metric that small-budget marketers often ignore at their peril. A low budget often means targeting smaller, more niche audiences, which can lead to rapid saturation and high frequency if not managed carefully.
The « right » frequency isn’t a single number; it’s a dynamic threshold that varies by audience temperature. A hot lead who abandoned their cart can tolerate—and may even need—a higher frequency to be persuaded to complete their purchase. In contrast, showing an ad to a completely cold prospect more than a few times can feel intrusive and spammy, generating negative sentiment and diminishing returns. Ignoring this nuance is a costly mistake.
The key is to set proactive frequency caps and automated rules to rotate your creatives before fatigue sets in. Don’t wait for your CPA to skyrocket. Monitor leading indicators like a declining CTR or an increase in negative comments. A strategic approach involves testing different frequency thresholds for each audience segment. For example, you might cap frequency at 3 over 7 days for a broad, cold audience, but allow it to reach 8 for a 7-day retargeting audience. This prevents burnout and ensures your message stays fresh, maximizing the efficiency of your limited ad spend.
By treating frequency not as an afterthought but as a core campaign lever, you protect your brand, prolong the life of your winning creatives, and ensure a healthier, more sustainable ROAS.
When to Kill a Winning Ad Before It Burns Out?
In paid social, all good things must come to an end. The ad that delivered a record-low CPA last week will inevitably suffer from performance decay. The challenge isn’t just finding a winner; it’s knowing when to pull that winner from rotation *before* it burns out and starts wasting your budget. Waiting for the CPA to double is a reactive, expensive strategy. A data-obsessed marketer uses leading indicators to anticipate decay and acts proactively.
The lifecycle of an ad follows a predictable curve: an initial learning phase, a peak performance period, and then a gradual decline as audience fatigue sets in. This decay is a natural process, and your job is to manage it. The visualization below uses the metaphor of a flower petal transitioning from fresh to dry to represent this inevitable performance lifecycle.

To stay ahead of this curve, you need an early warning system. This involves monitoring a basket of metrics, not just CPA. A slight dip in the 3-day rolling average CTR, a steady rise in CPM (Cost Per Mille), or an increase in ad frequency are all early signals that your ad is losing its effectiveness. This is true even in a positive market; recent analysis shows that despite improving click rates industry-wide, individual ad performance still decays. Answering the question of « how long should you A/B test? » is less about a fixed timeline (e.g., 72 hours) and more about monitoring these decay signals continuously.
Your Ad Decay Early Warning Checklist
- Performance Metrics: Track the 3-day rolling average CTR. Is it declining by more than 15% from its peak?
- Audience Saturation: Monitor frequency. Has it reached 4+ for cold audiences or exceeded your predetermined cap for warmer audiences?
- Cost Efficiency: Watch for a steady CPM increase. Has it risen by more than 20% from its baseline?
- Audience Sentiment: Check your ad comments. Has the positive sentiment score dropped, or are negative comments increasing?
- Continuous Testing: Implement an 80/20 champion-challenger budget split. Is your challenger ad starting to outperform your current champion on leading indicators?
This proactive approach allows you to rotate in fresh creative from your modular library just as the current winner begins to fade, maintaining stable performance and maximizing the return on every dollar.
Why Starting with the Problem Stops the Scroll Faster Than a Logo?
You have less than three seconds to earn a viewer’s attention in the Facebook feed. The most common mistake brands make is leading with their logo or a generic brand statement. This approach fails because it’s self-serving. Your audience doesn’t care about your brand (yet); they care about their own problems. The fastest way to stop the scroll is to open your video with a hook that immediately reflects a pain point the viewer is experiencing.
Leading with the problem works because it creates immediate relevance and empathy. When a viewer hears their own struggle articulated in the first few seconds of a video, their brain flags it as important. This is the foundation of the classic Problem-Agitate-Solve (PAS) framework. You start by stating the problem, you agitate it by describing the frustrations it causes, and only then do you introduce your product as the solution. This narrative structure is far more compelling than a « Here’s our product, here’s what it does » approach.
This isn’t just theory; it’s backed by data. An analysis of Facebook A/B tests by HubSpot revealed that ads using Problem-Agitate-Solve hooks consistently saw higher initial engagement compared to those leading with a Unique Selling Proposition. The effect was particularly strong for cold audiences with historically low engagement, proving that leading with empathy is the key to breaking through the noise. Your modular asset library should contain a variety of problem-led hooks to test, as this is often the single highest-leverage element of your video creative.
By shifting your focus from your brand to your customer’s pain, you transform your ad from an interruption into a welcome moment of recognition, earning you the attention needed to present your solution.
Why Do 60% of Viewers Abandon Your Sales Video Before the Call to Action?
You’ve successfully stopped the scroll with a killer hook. The viewer is engaged. But a few seconds later, they’re gone. A massive drop-off in video retention is one of the most common and frustrating problems in video advertising. If the majority of viewers leave before they even hear your Call to Action (CTA), you are effectively paying to talk to yourself. The primary culprit is a poorly structured video that fails to maintain momentum after the initial hook.
Viewers in a social feed have zero patience for fluff. Your video’s structure must be ruthlessly efficient, delivering value or intrigue in rapid-fire succession. Long, meandering explanations, slow-paced visuals, or a single monolithic block of information will kill your retention. Instead, think of your video’s body as a series of « mini-value points » delivered every 10-15 seconds. This could be a quick tip, a surprising fact, a visual demonstration, or a testimonial snippet. This pacing keeps the viewer engaged and wondering what’s next.
Furthermore, technical format choices play a huge role. Testing video aspect ratios is critical. In a famous test, Buffer found that square (1:1) videos drove 3X more engagement and significantly more views than traditional landscape (16:9) videos on mobile-first platforms like Facebook and Instagram. Square and vertical (9:16) formats take up more screen real estate, making them more immersive and harder to ignore.
To combat viewer abandonment, you need a retention optimization checklist:
- Test Length: Pit a 15-second version against a 30-second or 60-second version. Find the sweet spot for your audience.
- Maintain Pace: Ensure you are delivering a new piece of information or a compelling visual every 10-15 seconds.
- Test Format: Always A/B test square (1:1) versus vertical (9:16) formats to see which commands more attention on mobile.
- Monitor the Graph: In Ads Manager, analyze the video retention graph. A sharp, sudden drop at a specific point is a clear signal that part of your video needs to be fixed or cut.
- Optimize Audio: While most watch with sound off, test audio variations (voiceover vs. music vs. text-on-screen only) for the 20% who listen.
By building your videos with a tight structure and testing technical formats, you dramatically increase the chance that your audience will stick around long enough to hear—and act on—your CTA.
Key Takeaways
- Focus on conversion signals like CPA and ROAS; CTR is a vanity metric if it doesn’t lead to sales.
- Build a modular « Lego block » creative system to test hooks, value props, and CTAs with high velocity.
- Proactively monitor for performance decay and rotate creatives before they burn out to maintain campaign momentum.
How to Use Gated Video Content to Capture High-Quality B2B Leads?
While the previous principles apply universally, the strategy shifts slightly for high-ticket B2B lead generation. Here, the goal isn’t an immediate sale but the capture of a high-quality lead. Gated video content—where a viewer must submit their information via a lead form to watch the full video—can be an incredibly powerful tool. However, the placement of that « gate » is a critical variable to test, as it creates a direct trade-off between lead volume and lead quality.
The average conversion rate for Facebook lead campaigns is around 2.59%, but this figure blends all lead qualities. Your goal as a data-driven marketer is to find the right balance for your sales process. Gating the video at the very beginning ensures the highest possible lead intent—only those truly interested in the solution will fill out the form. This delivers a low volume of highly qualified leads, which is ideal for high-touch sales processes. Conversely, placing the gate at the very end after delivering the full value of the video will generate the highest volume of leads, but with much lower intent. These leads are better suited for a long-term email nurturing sequence.
A sophisticated approach is to test placing the gate in the middle, at a « cliffhanger » moment. You provide significant value upfront, demonstrate your expertise, and then gate the rest of the content (e.g., « To see the final two steps of this process… »). This often provides a balanced mix of volume and quality. Testing these three gate positions is a fundamental A/B test for any B2B video strategy.
This framework provides a clear guide for testing gate placement based on your specific B2B marketing objectives.
| Gate Position | Audience Quality | Volume | Best For |
|---|---|---|---|
| Beginning | Highest intent | Lowest volume | High-ticket B2B |
| Middle (Cliffhanger) | Moderate intent | Balanced volume | Educational content |
| End (Resource) | Lower intent | Highest volume | Lead nurturing |
By methodically testing your gate strategy, you can tailor your lead flow to perfectly match your sales team’s capacity and build a predictable pipeline of qualified B2B leads.